
How Have Sales Densities Really Changed at America’s Top Retailers, and How Much More Space Do Some of Them Need to Close?
KEY POINTS
In this report, we strip out e-commerce revenues at 12 major US nonfood retailers over the past five years to look at their real change in sales density (sales per square foot). We infer from these data how much space selected retailers would need to cut to restore sales densities to 2011 levels.
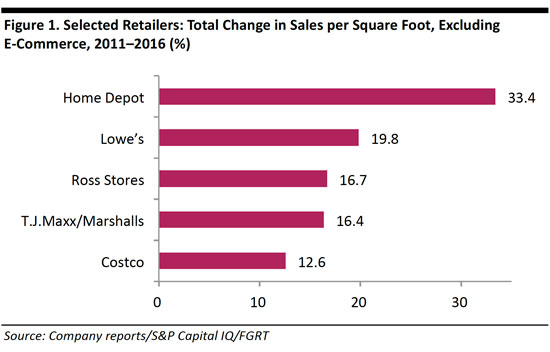
- It is not all bad news: even once we strip out e-commerce revenues, which have grown rapidly, Home Depot, Lowe’s, Ross Stores, T.J.Maxx/Marshalls and Costco all grew sales densities very strongly between 2011 and 2016.
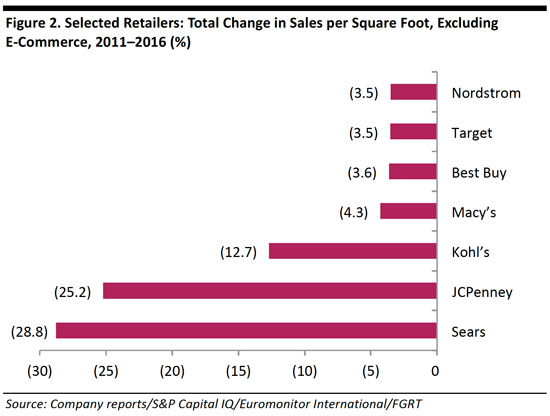
- On the downside, in-store sales per square foot at Sears and JCPenney fell by more than 20% in the five years ended 2016. Declines in in-store sales density have been much milder—below 5%—at major names such as Macy’s and Target.
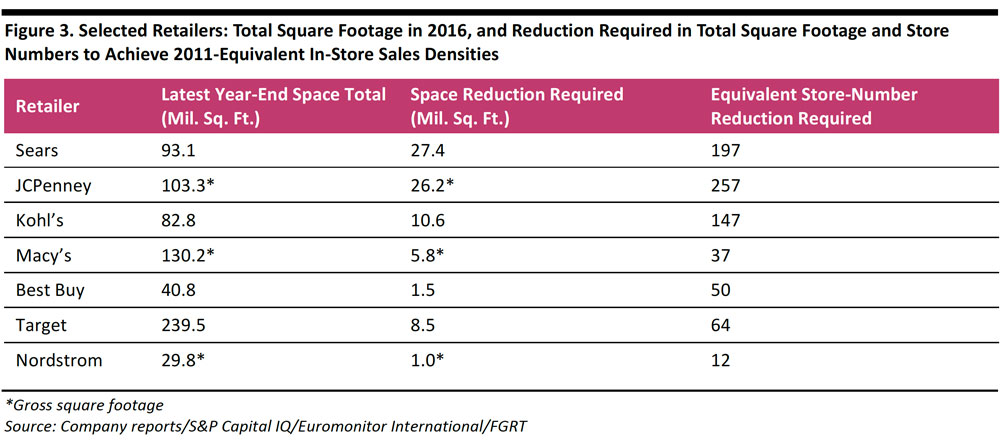
- Sears would need to close the equivalent of 197 stores to restore its in-store sales density to 2011 levels, while JCPenney would need to close 257 and Kohl’s 147. However, these figures are theoretical, as they assume no loss of sales from store closures.
Introduction: Stripping E-Commerce Sales Out of Sales Density Figures
Average annual sales per square foot of retail space (sales density) remains a key metric in retail. Sales densities are a staple of retail research, and many retailers publish this metric in their annual reports. But—and we think this is a big “but”—such sales density figures do not typically strip out e-commerce sales. This means that widely reported sales density figures often include sales that were not made in physical stores. With e-commerce growing fast, traditional sales density figures are getting less representative of in-store sales each year.
In this brief report, we offer our own figures, which adjust for e-commerce sales, to show how in-store sales densities at major US retailers really changed in the five years ended 2016. From them, we infer how much space some retailers would need to close in order to return to the sales densities they saw back in 2011. Our data are for 12 of the biggest nonfood retailers in the US: Best Buy, Costco, Home Depot, Kohl’s, JCPenney, Lowe’s, Macy’s, Nordstrom, Ross Stores, T.J.Maxx/Marshalls, Target and Sears.
We recognize that the shopping process for some online purchases may touch physical stores—for example, a customer may browse in-store before buying online or collect an online order in-store—but we think it is nevertheless worthwhile to sift out e-commerce sales in order to determine “real” sales densities. We outline our methodology at the end of this report.
We Have Good News and Bad News
As e-commerce continues to grow apace, it may seem reasonable to presume that sales densities in physical stores are falling or, at best, increasing only slowly, across the board. But, in fact, a number of major retailers saw substantial uplifts in sales per square foot in their physical stores over the five-year period we examined:
- Home improvement retailers performed best, with Home Depot growing its in-store sales per square foot by fully one-third between 2011 and 2016. This growth came despite the fact that Home Depot and Lowe’s each grew e-commerce revenues by an estimated 350% over the period.
- Off-price and value names such as Ross Stores and Costco grew their in-store sales densities by double digits.
Charted below are the major names that did not perform so well. Trailing among the set of 12 retailers we analyzed were Sears and JCPenney, whose in-store sales densities declined by around 29% and 25%, respectively, between 2011 and 2016.
- Sears is among the major retailers that have recognized the need to close stores, and it cut its square footage by 20% between 2011 and 2016. However, its in-store revenues fell by an estimated 42% over the same period.
- JCPenney’s sales density crashed under the stewardship of CEO Ron Johnson, who left the company in April 2013. The company has grown its in-store sales density each year since 2013.
- Macy’s is frequently presented as a retailer facing brick-and-mortar challenges, but its in-store sales density declined by only mid-single digits over the five-year period.
- The figures above show, in an inverted way, how much space these retailers would need to cut to return to the in-store sales densities they enjoyed in 2011. JCPenney, for example, would need to reduce its space by 25% (and retain all of its 2016 sales) in order to achieve such a metric. We explore in more detail the theoretical space reductions that retailers would need to make to restore sales densities in the following section.
How Much Space Do the Underperformers Need to Close?
Store closures are a major theme in US retail, as many overspaced retailers are reacting to the migration of sales online by closing physical locations. It is a trend we cover each week in our Weekly Store Openings and Closures Tracker.
- Our calculations suggest that Sears would need to reduce its selling space by 27.4 million square feet, equivalent to 197 stores, to return to its 2011 in-store sales density.
- JCPenney would need to cut 26.2 million square feet of store space, equivalent to 257 stores, to reach 2011 sales per square foot. By the same measure, Kohl’s would need to close 10.6 million square feet, equivalent to 147 stores.
- These closure estimates are theoretical, as they assume no loss of sales from closures: in reality, sales transference from closed stores to existing stores within the same chain can be very low.
- It is worth noting that these estimates are based on total sales and e-commerce sales through 2016—as e-commerce continues to grow share, the total space reduction needed to restore 2011 in-store sales densities would increase.
- Readers may also be interested in our March 2017 report Deep Dive: Opportunities from US Department Stores’ Closures.
Notes on Methodology
Our sales density figures represent US-only sales per square foot once online sales are excluded. Lowe’s is the exception: we have used global revenues, square footage and online sales for Lowe’s because the company does not break out these figures for the US market in its filings (Lowe’s operates in Canada and Mexico as well as in the US). For Home Depot and Sears, we have estimated US square footage based on average store sizes and store counts.
We have averaged each retailer’s square footage for each year: companies typically report what their selling space is at year-end, so we used an average for each fiscal year.
Our e-commerce figures are principally based on data and indications provided by the companies themselves in conference calls (via transcripts), annual reports and quarterly results. For those retailers that offer e-commerce in multiple countries but do not break out e-commerce figures for the US only, we have estimated e-commerce figures for the US market. A number of the companies we analyzed have stopped breaking out e-commerce figures in recent years: in these cases, we have extrapolated from past years’ data using the indications management has given. Sears and Macy’s traditionally do not disclose online revenues, so we have used estimated annual e-commerce sales for them from Euromonitor International.
We have used the fiscal years closest to the referenced calendar years. The fiscal year for most of the companies discussed in this report ends in January. So, for example, references to 2016 indicate the fiscal year ended January 2017. Costco is the exception: its fiscal year ends in August, so for 2016, for example, we used the fiscal year ended August 2016.
Finally, the 12 retailers chosen represent the largest retailers in the US in 2016, per Euromonitor International, excluding retailers that predominantly sell food (a set that includes Walmart). We have also excluded two major dollar-store retailers, Dollar General and Dollar Tree, given that there is an extreme paucity of online sales data for them and that they are borderline grocery stores.