
Amazon Vs. Top US Retailers: Margins And International Sales
KEY POINTS
- This report analyzes Amazon and the other top-10 US retailers on three metrics—gross margins, SG&A expense as a percentage of revenues and share of international sales—during 2010–15.
- Amazon ranked in the top third among retailers in gross margins in 2015 and experienced a nearly 11 percentage-point increase during 2010–15.
- Amazon’s SG&A to revenue ratio ranks in the middle of retailers and the company’s ratio increased six percentage points during the five-year period.
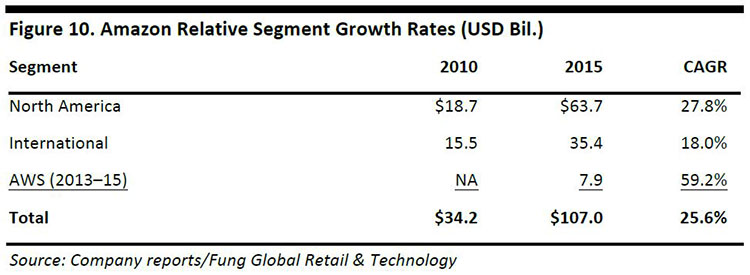
- Compared to the other retailers studied, Amazon had the highest share of international sales during the period. The company’s international-sales ratio dropped during 2010–15 due to the faster growth of its North American segment, which had nearly a 28% CAGR.
EXECUTIVE SUMMARY
Amazon has experienced phenomenal growth since its initial public offering, in 1997. Although the company was the subject of much criticism due to its lack of profits, Amazon has remained profitable since 2Q 2015, and reported stunning 31% revenue growth in its most recent quarter, 2Q 2016. This growth has vaulted Amazon into the middle of the top-10 US retailers, and this is an appropriate time to take a look at the group.
This report analyzes Amazon and the other top-10 US retailers on three metrics—gross margins, SG&A expense as a percentage of revenues and share of international sales—during 2010–15.
During that period, retailers’ gross margins declined by an average of a half a point, whereas Amazon’s gross margins climbed by nearly 11 points. During 2010–15, retailers’ SG&A expense as a percentage of revenues declined by nearly a point, whereas Amazon’s expense ratio increased by more than six points and represents investments to increase capacity and drive growth.
Regarding international sales, six of the top-ten retailers are domestic-only vendors. International sales for Costco and Walmart remained within a range, and Best Buy’s ratio declined because the company exited some international business. Amazon’s ratio also declined—not from an international pullback, but due to higher growth rate of its North American business.
GROSS MARGINS
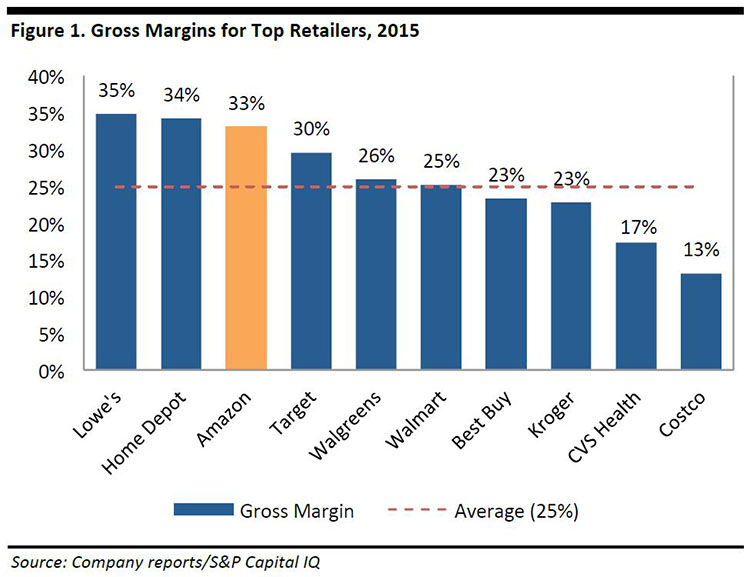
The graph below shows gross margins for top retailers in 2015, which ranged from 13% to 35%. The group average was 25%, Amazon’s gross margin was 33%.
The graph above represents only a snapshot of one year; the change in margins over time tells the story better. The graph below depicts margins ranging from 12% to 35%; the average for the group varied between 24% and 25%.
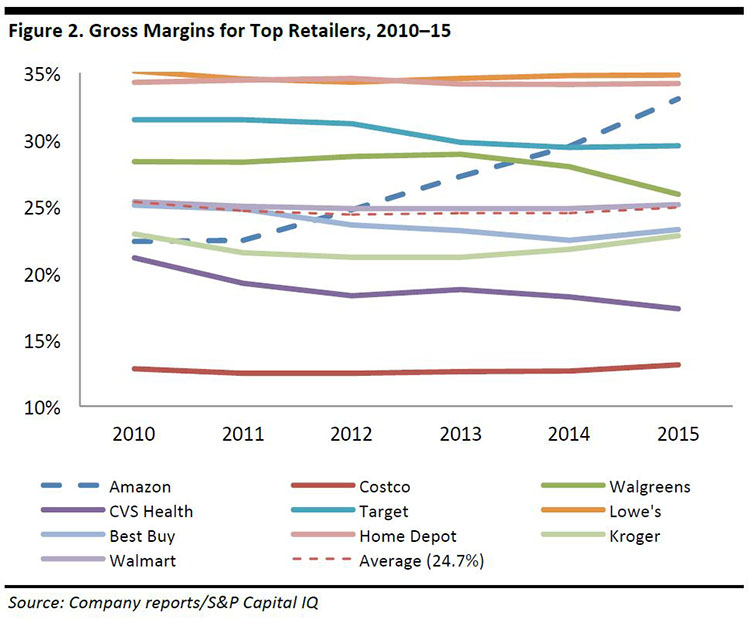
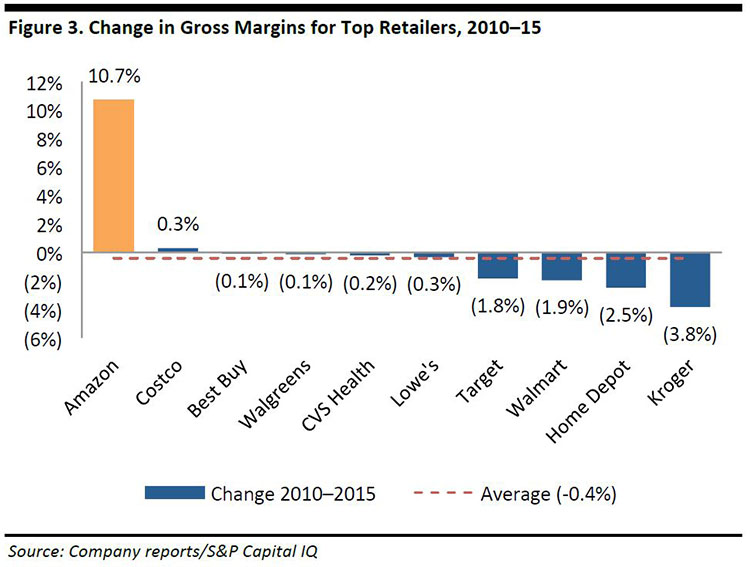
Most of the retailers’ margins remained roughly within the same range, with one exception—Amazon—which had a dramatic climb in gross margin during 2010–15. In the graph below, we see Amazon’ gross margins increased nearly 11 points during the period; most margins remained the same and the margins of four retailers decreased more than one percentage point.
SG&A EXPENSE
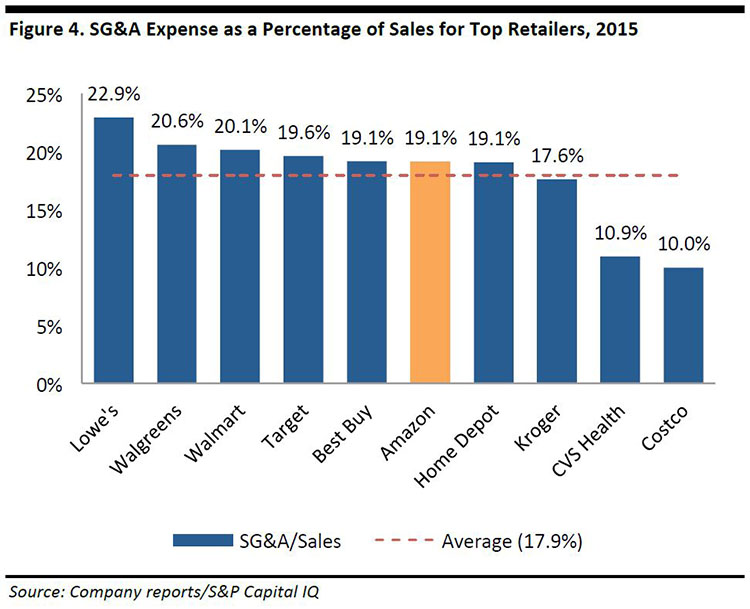
The graph below shows SG&A expense as a percentage of revenues for leading retailers, which fall within the range of 10% to 22.9% of sales, with an average of 17.9%. Amazon falls above the 17.9% mean, but in line with the 19.1% median of the group.
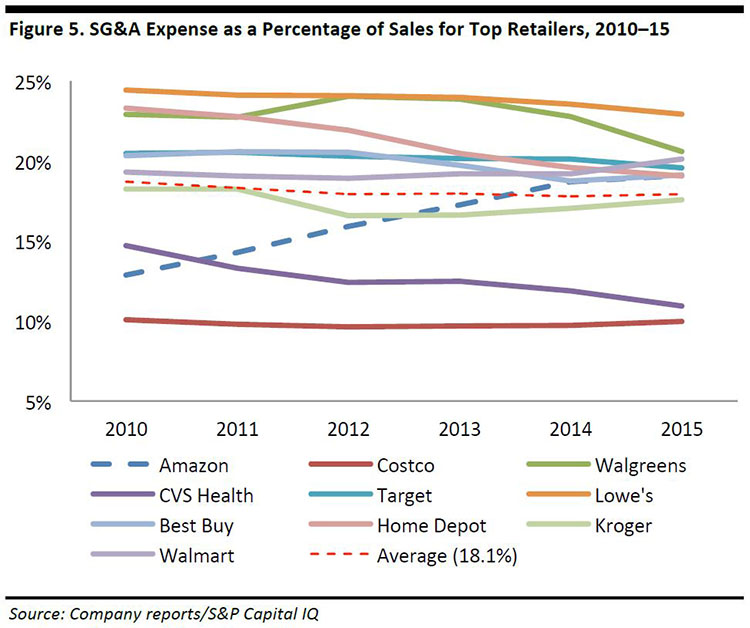
Over the five-year period, SG&A expense as a percentage of sales ranged from 10% to 24%, with the average in the range of 18%–19%. Although some spending ratios fluctuated, Amazon’s SG&A ratio increased dramatically during the period.
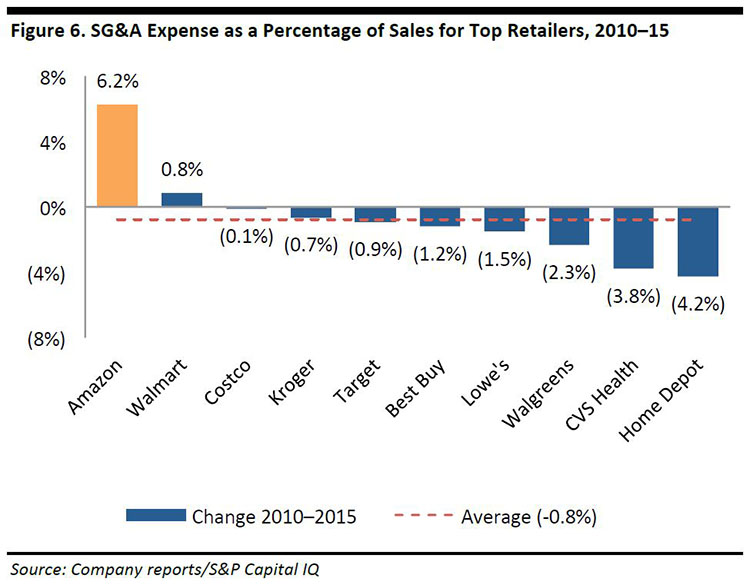
During 2010–15, Amazon’s SG&A/sales ratio increased by more than six percentage points, Walmart’s increased by nearly a point, and the other companies in the group decreased SG&A expense as a percentage of sales by 0.1%–4.2%.
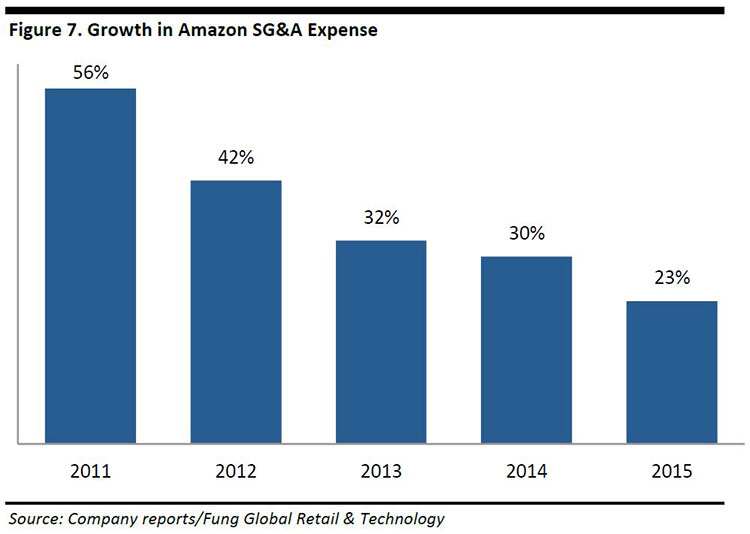
SG&A expense for Amazon, according to S&P Capital IQ, consists of fulfilment, marketing, and general and administrative expense (i.e., excluding technology and content). In the figure below, we see that this spending experienced the highest growth rates in 2011, and declined each year since, as seen in the figure below.
These expenses were essentially investments Amazon made to grow its business. The company explained the increase in fulfilment costs was related to higher sales volume, inventory and sales levels, and from expanding capacity. Marketing spending went to online and TV advertising and its Associates. General and Administrative expenses (G&A) grew with expanding payroll and professional services.
INTERNATIONAL SALES
Only four of the top-10 retailers have substantial international sales—Amazon, Best Buy, Costco and Walmart—and the international share of their sales is shown in the figure below, led by Amazon.
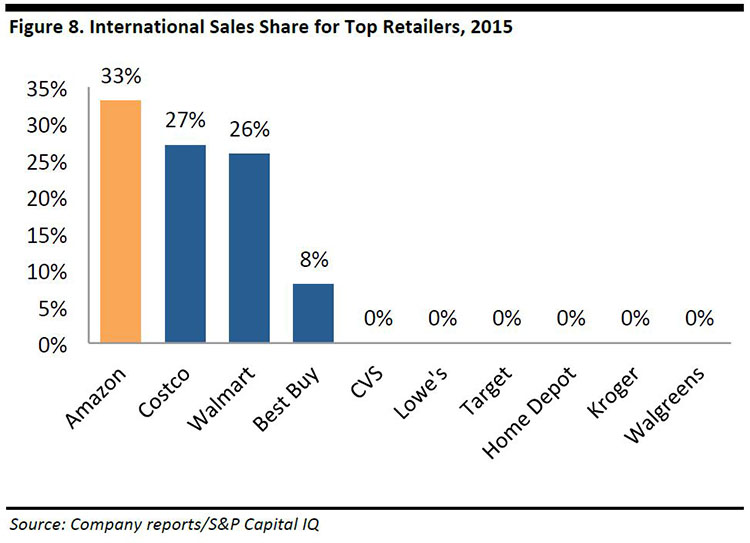 The figure below shows international sales as a percentage of total sales during 2010–15.
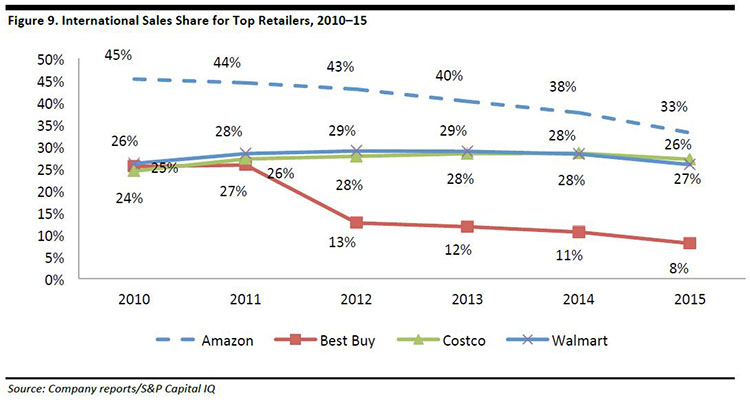
From the graph above, we make the following additional observations:
- The share of international sales appears to have declined in general during 2010–15.
- Although Amazon had the highest share of international sales in 2015, its international share of sales declined by 12 percentage points during 2010–15. This figure counts Amazon Web Services (AWS) as US sales; the graph is slightly less steep excluding AWS. See discussion below.
- The share of Costco’s international sales increased by three points during 2010–15, as the company’s international store count grew at a 10.7% CAGR during 2010–15, as compared to a 2.9% CAGR for US-based stores.
- Walmart’s share of international sales remained within a range of 26%–29%.
- Best Buy’s share of international sales stepped down in 2012 and declined substantially during 2012–15. In the fourth fiscal quarter of 2012, Best Buy discontinued its large-format Best Buy branded stores in China, Turkey and the UK, and The Phone House retail stores in Belgium. The company closed 211 international stores in 2012, three in 2013, six stores in 2014 and 71 stores in 2015.
When we look at Amazon again, the graph in Figure 9. can lead to the wrong conclusion. Amazon’s international business did not decline during 2010–15; rather, Amazon’s North American business grew at a faster rate, at a 27.8% CAGR during 2010–15, compared to a still-healthy 18% CAGR for the international segment, versus a 25.6% CAGR for total revenues, which leads to the appearance of a decline.
CONCLUSION
Following its IPO in 1997, Amazon’s phenomenal growth has landed it solidly in the top-10 US retailers in terms of revenue. Although Amazon’s business model was initially focused on growth at the expense of profitability, the company appears to have turned sustainably profitable 2Q 2015 and now possesses financial ratios similar to other retailers. In 2015, Amazon ranked in the top third among retailers in gross margins, in the middle of retailers in terms of its revenue ratio ranks, and Amazon leads the group in its share of international sales.